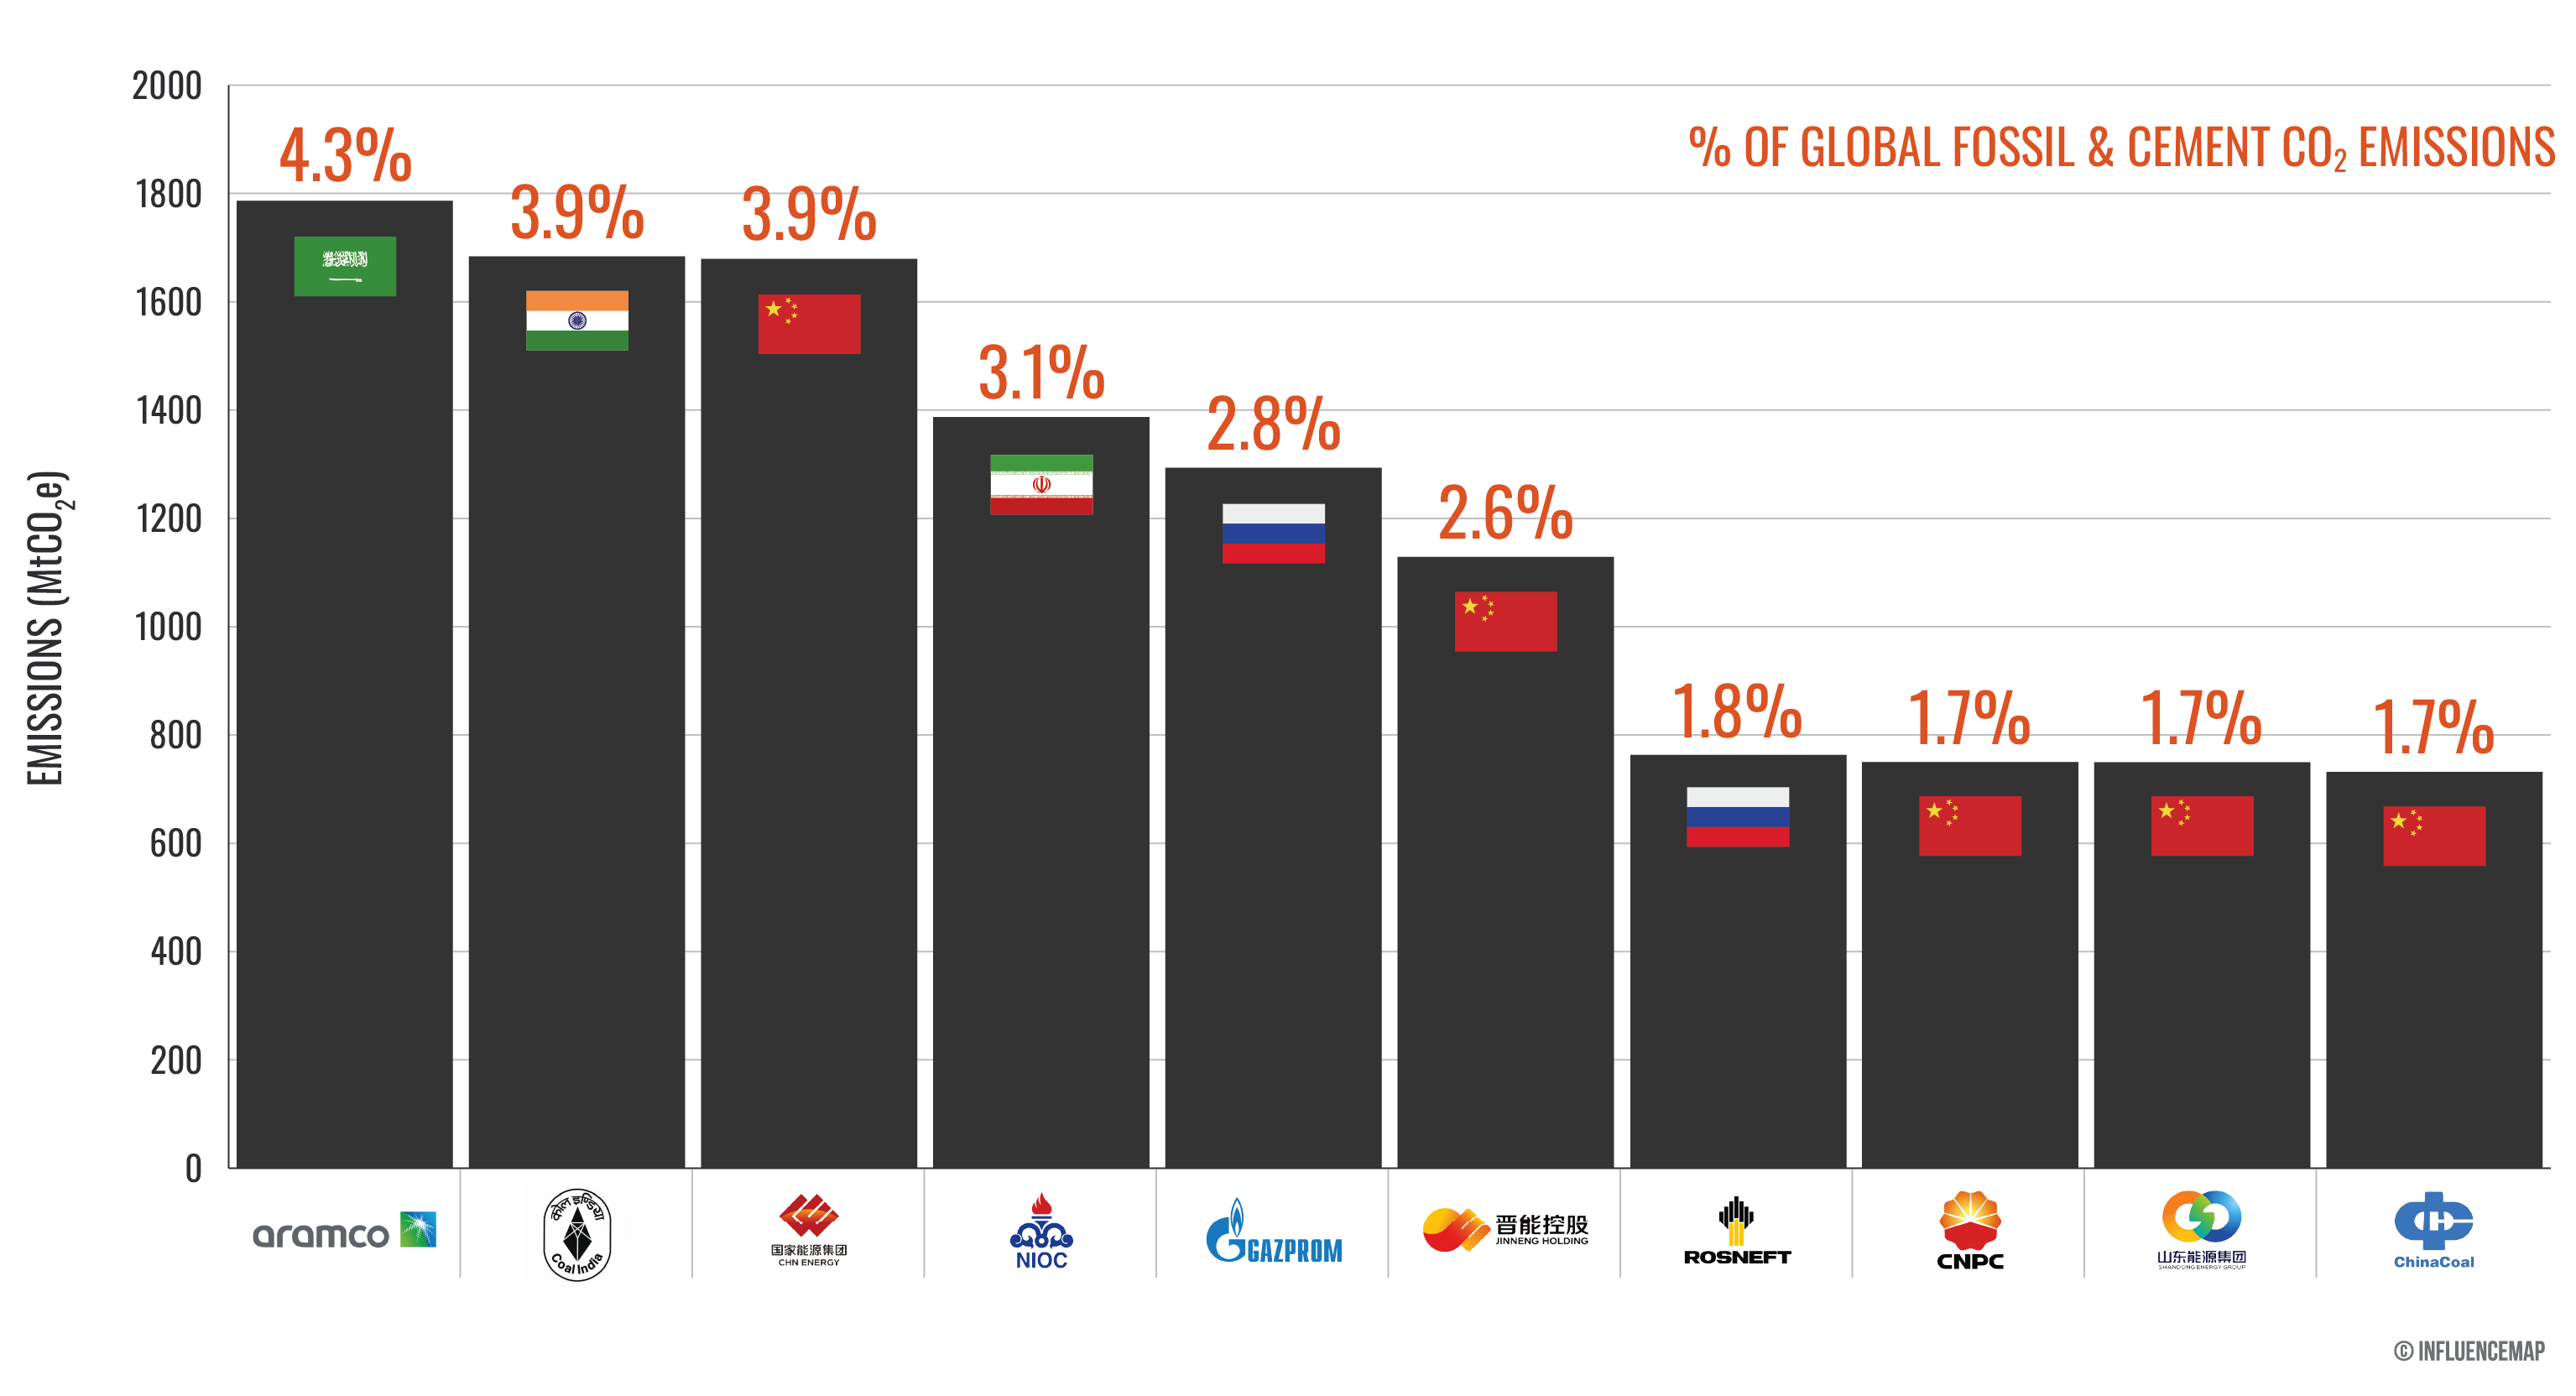
The Carbon Majors database traces 34.7 GtCO2e of greenhouse gas emissions in 2024 to the 166 oil, gas, coal, and cement producers, a 0.8% increase from these entities’ total emissions in 2023. Just 32 companies were linked to over half of global fossil fuel and cement CO2 emissions in 2024. As shown in Figure 1, the top 10 companies by emissions, cumulatively responsible for 27.6% of global fossil CO2 emissions in 2024, were all fully or majority state-owned companies.
Carbon Majors is a database of historical production data for 178 of the world’s largest oil, gas, coal, and cement producers, consisting of 166 active and 12 inactive entities. This data is used to quantify the direct production-linked operational emissions and emissions from the combustion of marketed products that can be attributed to these entities. The database is updated annually and is available at carbonmajors.org. This briefing presents the updated data for the 2024 reporting year.
State-owned companies dominated global fossil fuel emissions in 2024. The database shows that state-owned companies accounted for 54.0% of emissions, while 93 investor-owned companies accounted for 23.7%. This analysis also finds that most state-owned companies (54%) increased emissions year-over-year, whereas a majority of investor-owned companies (57%) reduced theirs.
Emissions are increasingly concentrated among a smaller number of companies. In 2024, just 32 companies were responsible for over half of global fossil CO₂ emissions, down from 38 five years earlier. Two thirds of companies in the top half of the rankings increased their emissions from 2023 to 2024, compared to just 28% of entities in the bottom half, with growth among the largest entities driven by both mergers and acquisitions and continued expansion of production.
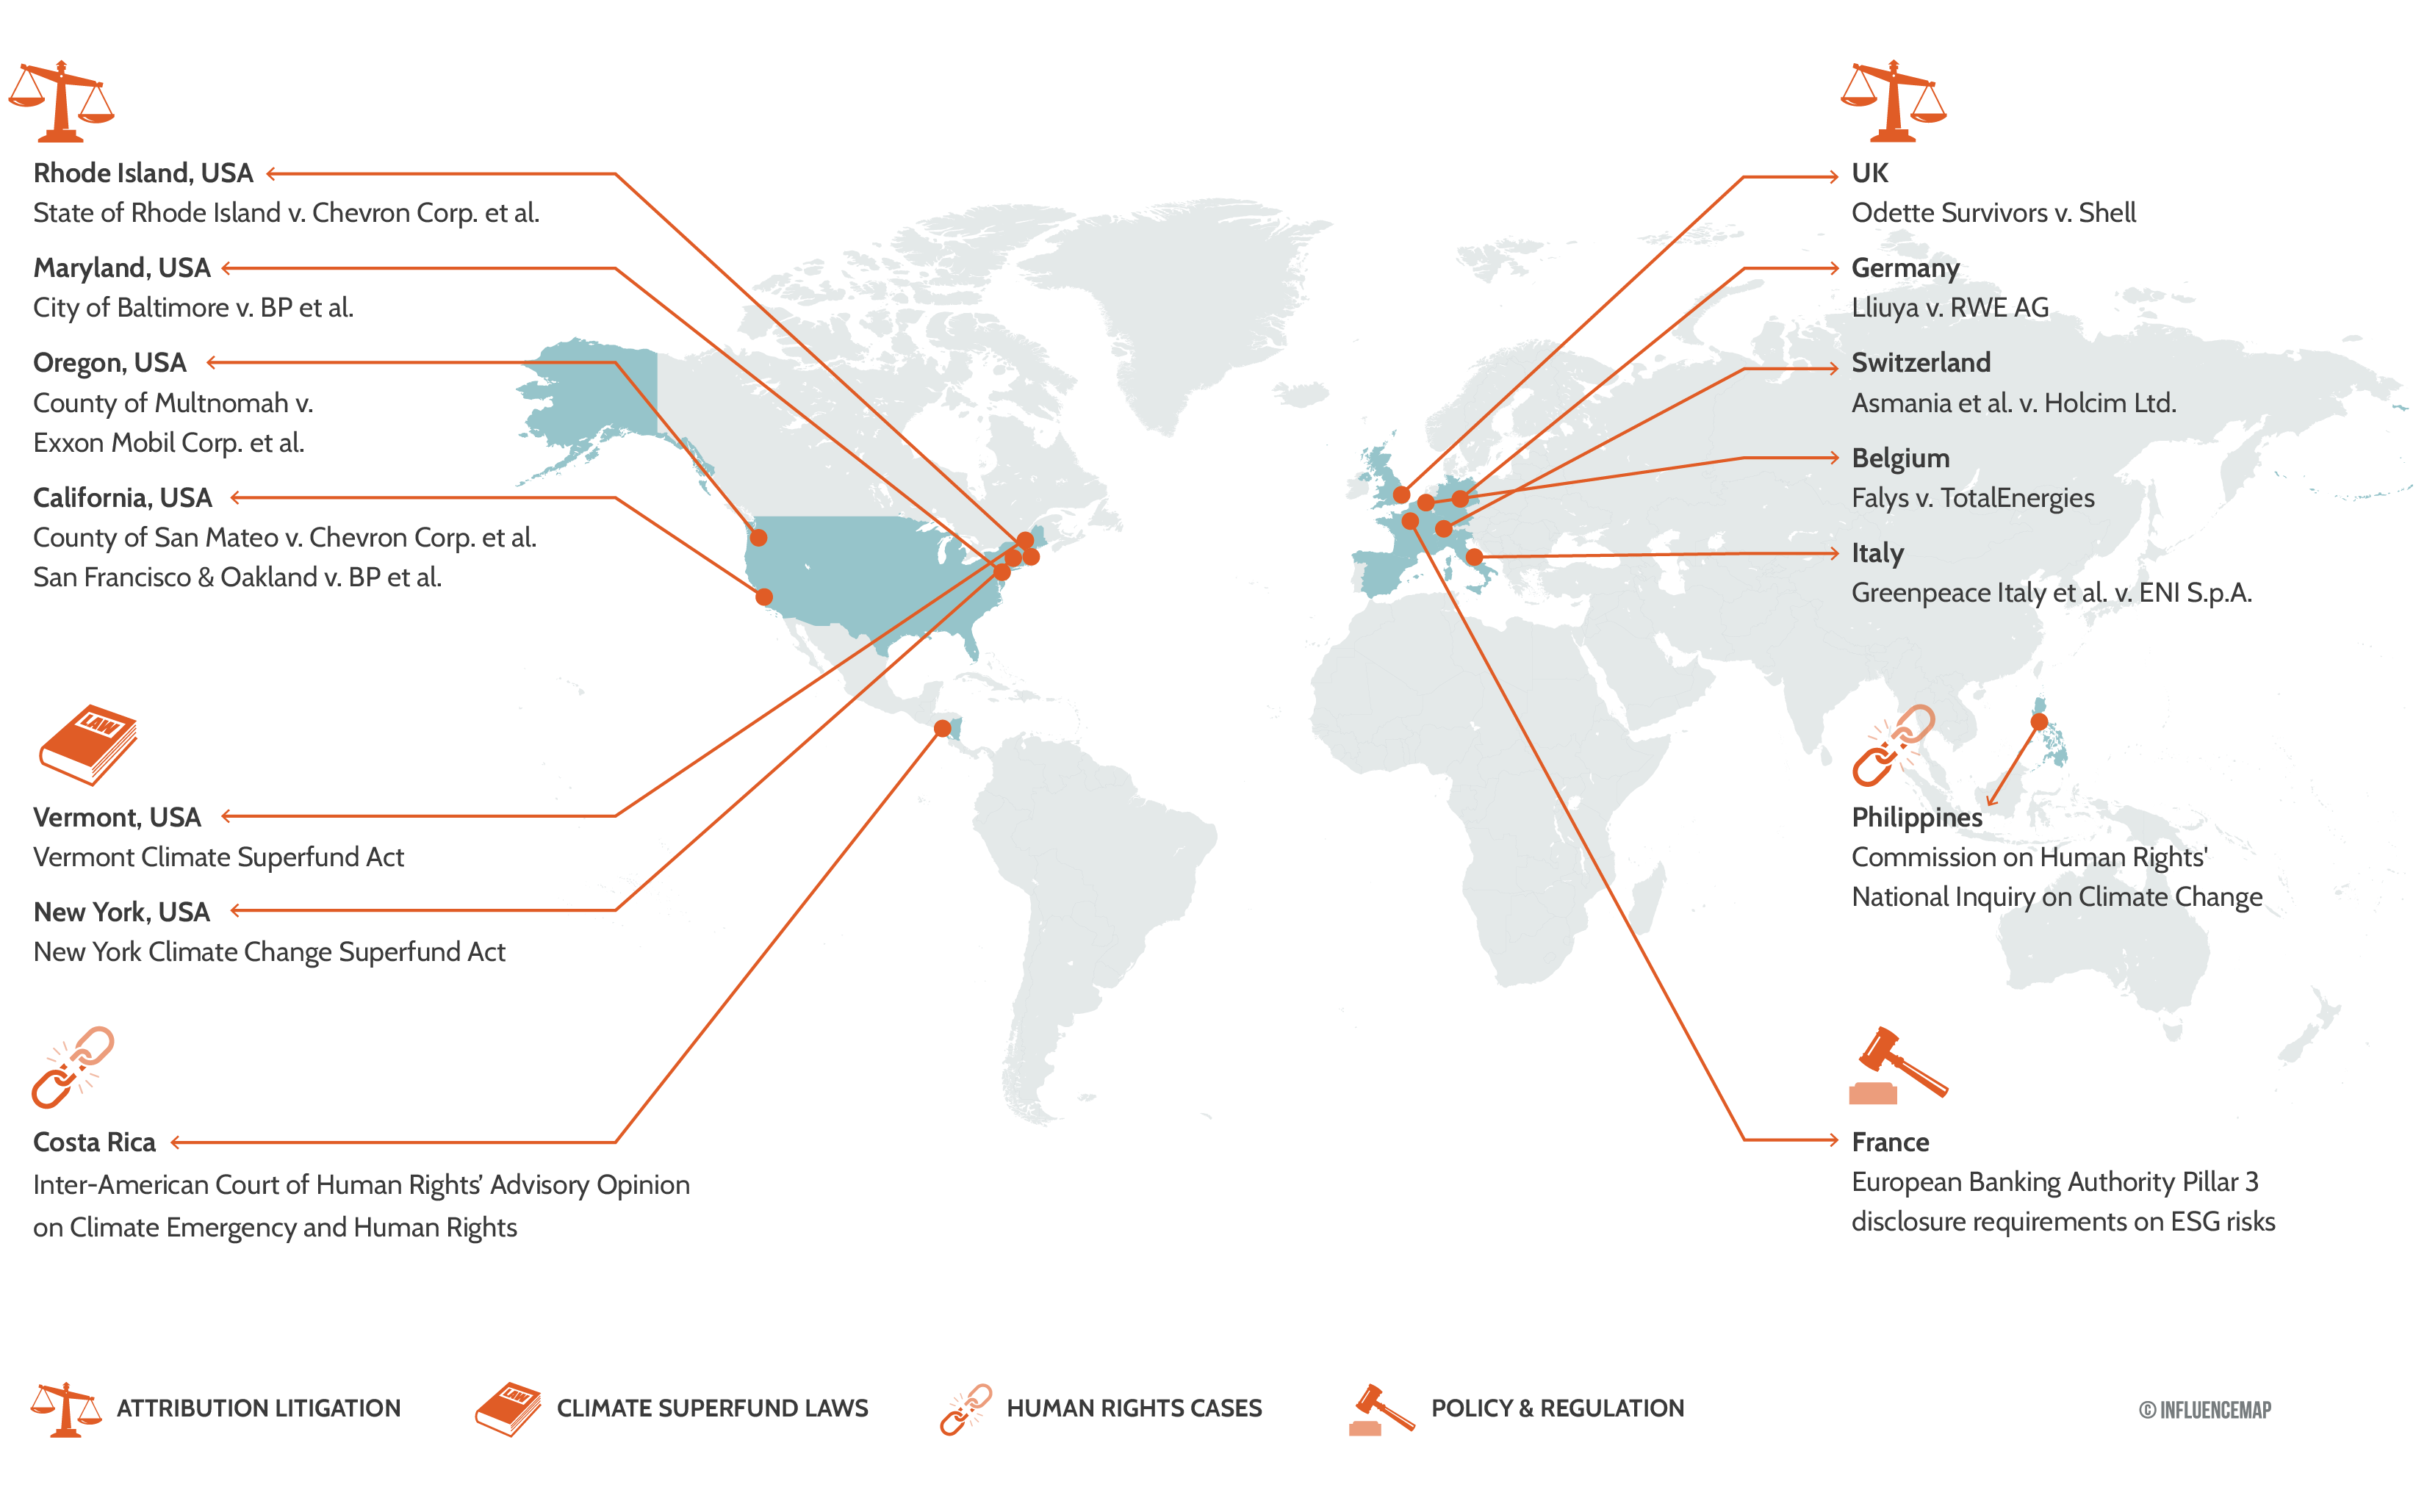
In 2025, accountability mechanisms grounded in historical corporate emissions have continued to gather pace, with the Carbon Majors database serving as a core evidentiary resource:
According to the European Union’s Copernicus Climate Change Service, 2024 marked the first calendar year in which the global average temperature exceeded 1.5°C above pre-industrial levels (1850-1900). Although this does not yet constitute a breach of the Paris Agreement’s long-term limit, which is defined over multi-decadal averages, it serves as a stark warning of the urgent need for climate action. The year also saw a record high in global greenhouse gas emissions of 53.2 GtCO₂e1, up 1.3% from 2023. Meanwhile, global CO₂ emissions from fossil fuels reached approximately 38.6 GtCO₂ in 2024, the highest level on record, increasing 1.3% from 20232.
The Production Gap Report 2025 found that, 10 years after the Paris Agreement, governments plan to produce over 120% more fossil fuels in 2030 than would be consistent with the Agreement’s 1.5°C goal pathway. Within these plans, fossil fuel production levels exceed 1.5°C-consistent limits by 500% for coal, 31% for oil, and 92% for gas in 2030. Seeking to address this misalignment an EU-led coalition of over 80 countries proposed a roadmap to transition away from fossil fuels at the most recent COP30 in November 2025. The plan was blocked by strong opposition from countries such as Saudi Arabia, Russia, China, and India, highlighting persistent political barriers to accelerating global climate action as reported by the International Institute for Sustainable Development’s Earth Negotiations Bulletin which is the only organisation authorised to summarise proceedings from UN negotiations closed to the media.
First released in 20133 by Richard Heede of the Climate Accountability Institute (CAI), the Carbon Majors Database traces emissions from fossil fuel and cement production back to the companies responsible. InfluenceMap now hosts the database on carbonmajors.org, making it widely accessible and providing annual updates.
The database focuses on holding major hydrocarbon producers accountable, aggregating emissions data by company rather than by country. This provides a direct link between corporate activity and climate change, helping to identify the small group of companies whose emissions have contributed disproportionately to global warming.
Since its original release in 2013, Carbon Majors has been widely used in climate litigation, legislation, academic research, regulatory and financial contexts, establishing itself as a key tool for understanding corporate contributions to climate change.
1 Crippa, M. et al., GHG emissions of all world countries - 2025 Report, Publications Office of the European Union, Luxembourg, 2025, doi:10.2760/9816914, JRC143227.
2 Global Carbon Budget. Friedlingstein et al. Earth System Science Data, 2025.
3 Heede, R. Tracing anthropogenic carbon dioxide and methane emissions to fossil fuel and cement producers, 1854–2010. Climatic Change 122, 229–241 (2014).
Corporate responsibility is increasingly recognized as central to addressing the climate crisis. This shift is happening through a range of avenues, from legal and legislative efforts to academic and policy-driven initiatives, with the Carbon Majors database providing a foundational basis for accountability in many of these cases.
According to the Grantham Institute’s Global Trends in Climate Change Litigation: 2025 Snapshot, at least 226 new climate cases were filed in 2024, 20% of which now target corporations. Notably, the report states that cases against corporate defendants appear to have a higher overall success rate compared to non-corporate defendants, underscoring the growing viability of corporate climate litigation as a strategy.
One example is Lliuya v. RWE AG. In this case, Peruvian farmer Saúl Luciano Lliuya sued the German energy company for its contribution to climate change and the risks posed to his community from melting glaciers. In May 2025, Germany's Higher Regional Court of Hamm dismissed the lawsuit, but the decision was significant: it recognized that companies could, in principle, be held liable for climate-related harm and accepted scientific climate attribution evidence connecting corporate emissions to environmental impacts. Central to this evidence was the Carbon Majors database, which allowed the court to trace emissions directly to RWE. While the case did not rule in Lliuya’s favor, it set an important precedent for establishing accountability in future climate litigation.
The database was also cited in the Inter-American Court of Human Rights’ Advisory Opinion on Climate Emergency and Human Rights, where it was used as evidence that a small group of corporate producers are disproportionately responsible for historical global emissions, supporting the Court’s conclusion that states have a duty to regulate corporate climate harms on human-rights grounds. By linking corporate emissions to human rights impacts, Carbon Majors provides a foundation for legal accountability at both national and international levels.
Carbon Majors continues to play a pivotal role in shaping Climate Superfund legislation in the US. These laws are designed to hold major fossil fuel companies financially accountable for the damages caused by their emissions, and to use those funds for mitigation and adaption measures. Two laws have been passed, in New York, requiring $75 billion in payments, and in Vermont, where a rough estimates from the Vermont Public Interest Research Group suggested approximately $2.5 billion in recoverable damages. More than a dozen proposals are at various stages in other states. In California, for example, analyses suggest the total recoverable damages could reach hundreds of billions of dollars, accounting for wildfires, droughts, sea-level rise, flooding, and adaptation needs through 2045.
Senator Krueger highlighted the importance of the Carbon Majors database during a press release for the introduction of the New York bill stating that: “based on the research of Dr. Richard Heede, it is now possible to use company records to determine the amount of product put into the marketplace by each large fossil fuel company and to translate that into an amount of greenhouse gas emitted into the atmosphere. The formula for doing so is specifically written into the bill language.”
Carbon Majors data has been used to link company-level emissions to a range of climate impacts, including extreme heat, economic losses, and sea level rise. Quilcaille et al. (2025) used the database to systematically link heatwaves to emissions from major fossil fuel producers. The study found that emissions from any one of the 14 largest companies were sufficient to make more than 50 historical heatwaves virtually impossible without their influence. Callahan & Mankin (2025) quantified trillions of dollars in heat-related losses attributable to individual fossil fuel producers, showing that tracing emissions to specific harms is now scientifically feasible and supports climate liability claims. Sadai et al. (2025), found that nearly half of the present-day surface temperature increase and one-third of sea level rise can be traced to the 122 largest fossil fuel producers, highlighting the urgency of phasing out fossil fuels and the intergenerational injustice of their continued use. Carbon Majors is also referenced in Merner et al.’s 2025 study highlighting how internal corporate records, emissions data, and attribution science are being used to support lawsuits by states, cities, and tribes for climate damages and fraud.
Carbon Majors traces greenhouse gas emissions from fossil fuels and cement produced by companies from as early as 1854 to the present. This section provides a brief overview of the database’s methodology. For a detailed more explanation, see the Methodology Page or refer to Rick Heede’s 2014 paper, Carbon Majors: Methods & Results Report.
Carbon Majors selects the largest oil, gas, coal, and cement producers based on their production. These entities are categorized as either investor-owned, state-owned, or nation-state producers. Nation-state producers are used primarily in the coal sector and are included only when investor-owned or state-owned companies haven’t been established or played a minor role in the relevant country.
Production data is obtained for each entity and is primarily based on self-reported figures, with third-party sources used when necessary. This data is standardized to common commodity types, each with a standard unit: Oil & Natural Gas Liquids (million barrels), Natural Gas (billion cubic feet), and Coal (million tonnes). To improve data accuracy, coal production is further categorized by rank, such as bituminous or anthracite, or by utilization, such as thermal or metallurgical.
Emission factors for each fuel type are used to estimate the carbon content released when these fossil fuels are combusted. Applying this factor to the standardized production results in the emissions from the combustion of marketed products, comprising nearly 90% of total emissions tracked by the database. These are Scope 3 Category 11 emissions, corresponding to "use of sold products". Four direct, operational Scope 1 emissions are then estimated: the flaring and venting of CO₂ at oil and gas facilities, fugitive methane from coal, oil, and gas operations, and CO₂ from a producer’s own fuel use (mainly gas production). Both Scope 1 and Scope 3 emissions are then aggregated to determine the total emissions for a company in a given year and historically. Estimation of CO2 emissions for cement production differs from that for fossil fuel production. Cement emissions are calculated based on process emissions from limestone calcining and exclude fuel and electricity inputs already accounted for by fossil fuel producers.
This research compares the emissions tracked by the Carbon Majors database to total fossil fuel and cement emissions since the beginning of the Industrial Revolution. Data from the Carbon Dioxide Information Analysis Center (CDIAC), and more recently the Global Carbon Project, provides this total, amounting to 1,812 GtCO2 from 1750 to 2024. The CO2 emissions figures obtained from the above calculations (excluding fugitive methane CO2 equivalent emissions) are compared to this total to calculate entities' relative contributions to total fossil fuel and cement emissions.
This section presents an analysis of the Carbon Majors database, beginning with emissions in 2024 and a historical overview of the data. It then explores emissions by entity type, examines the continued concentration of emissions among major producers, analyses emissions by region, and concludes with an overview of the climate policy engagement of the largest companies in the database.
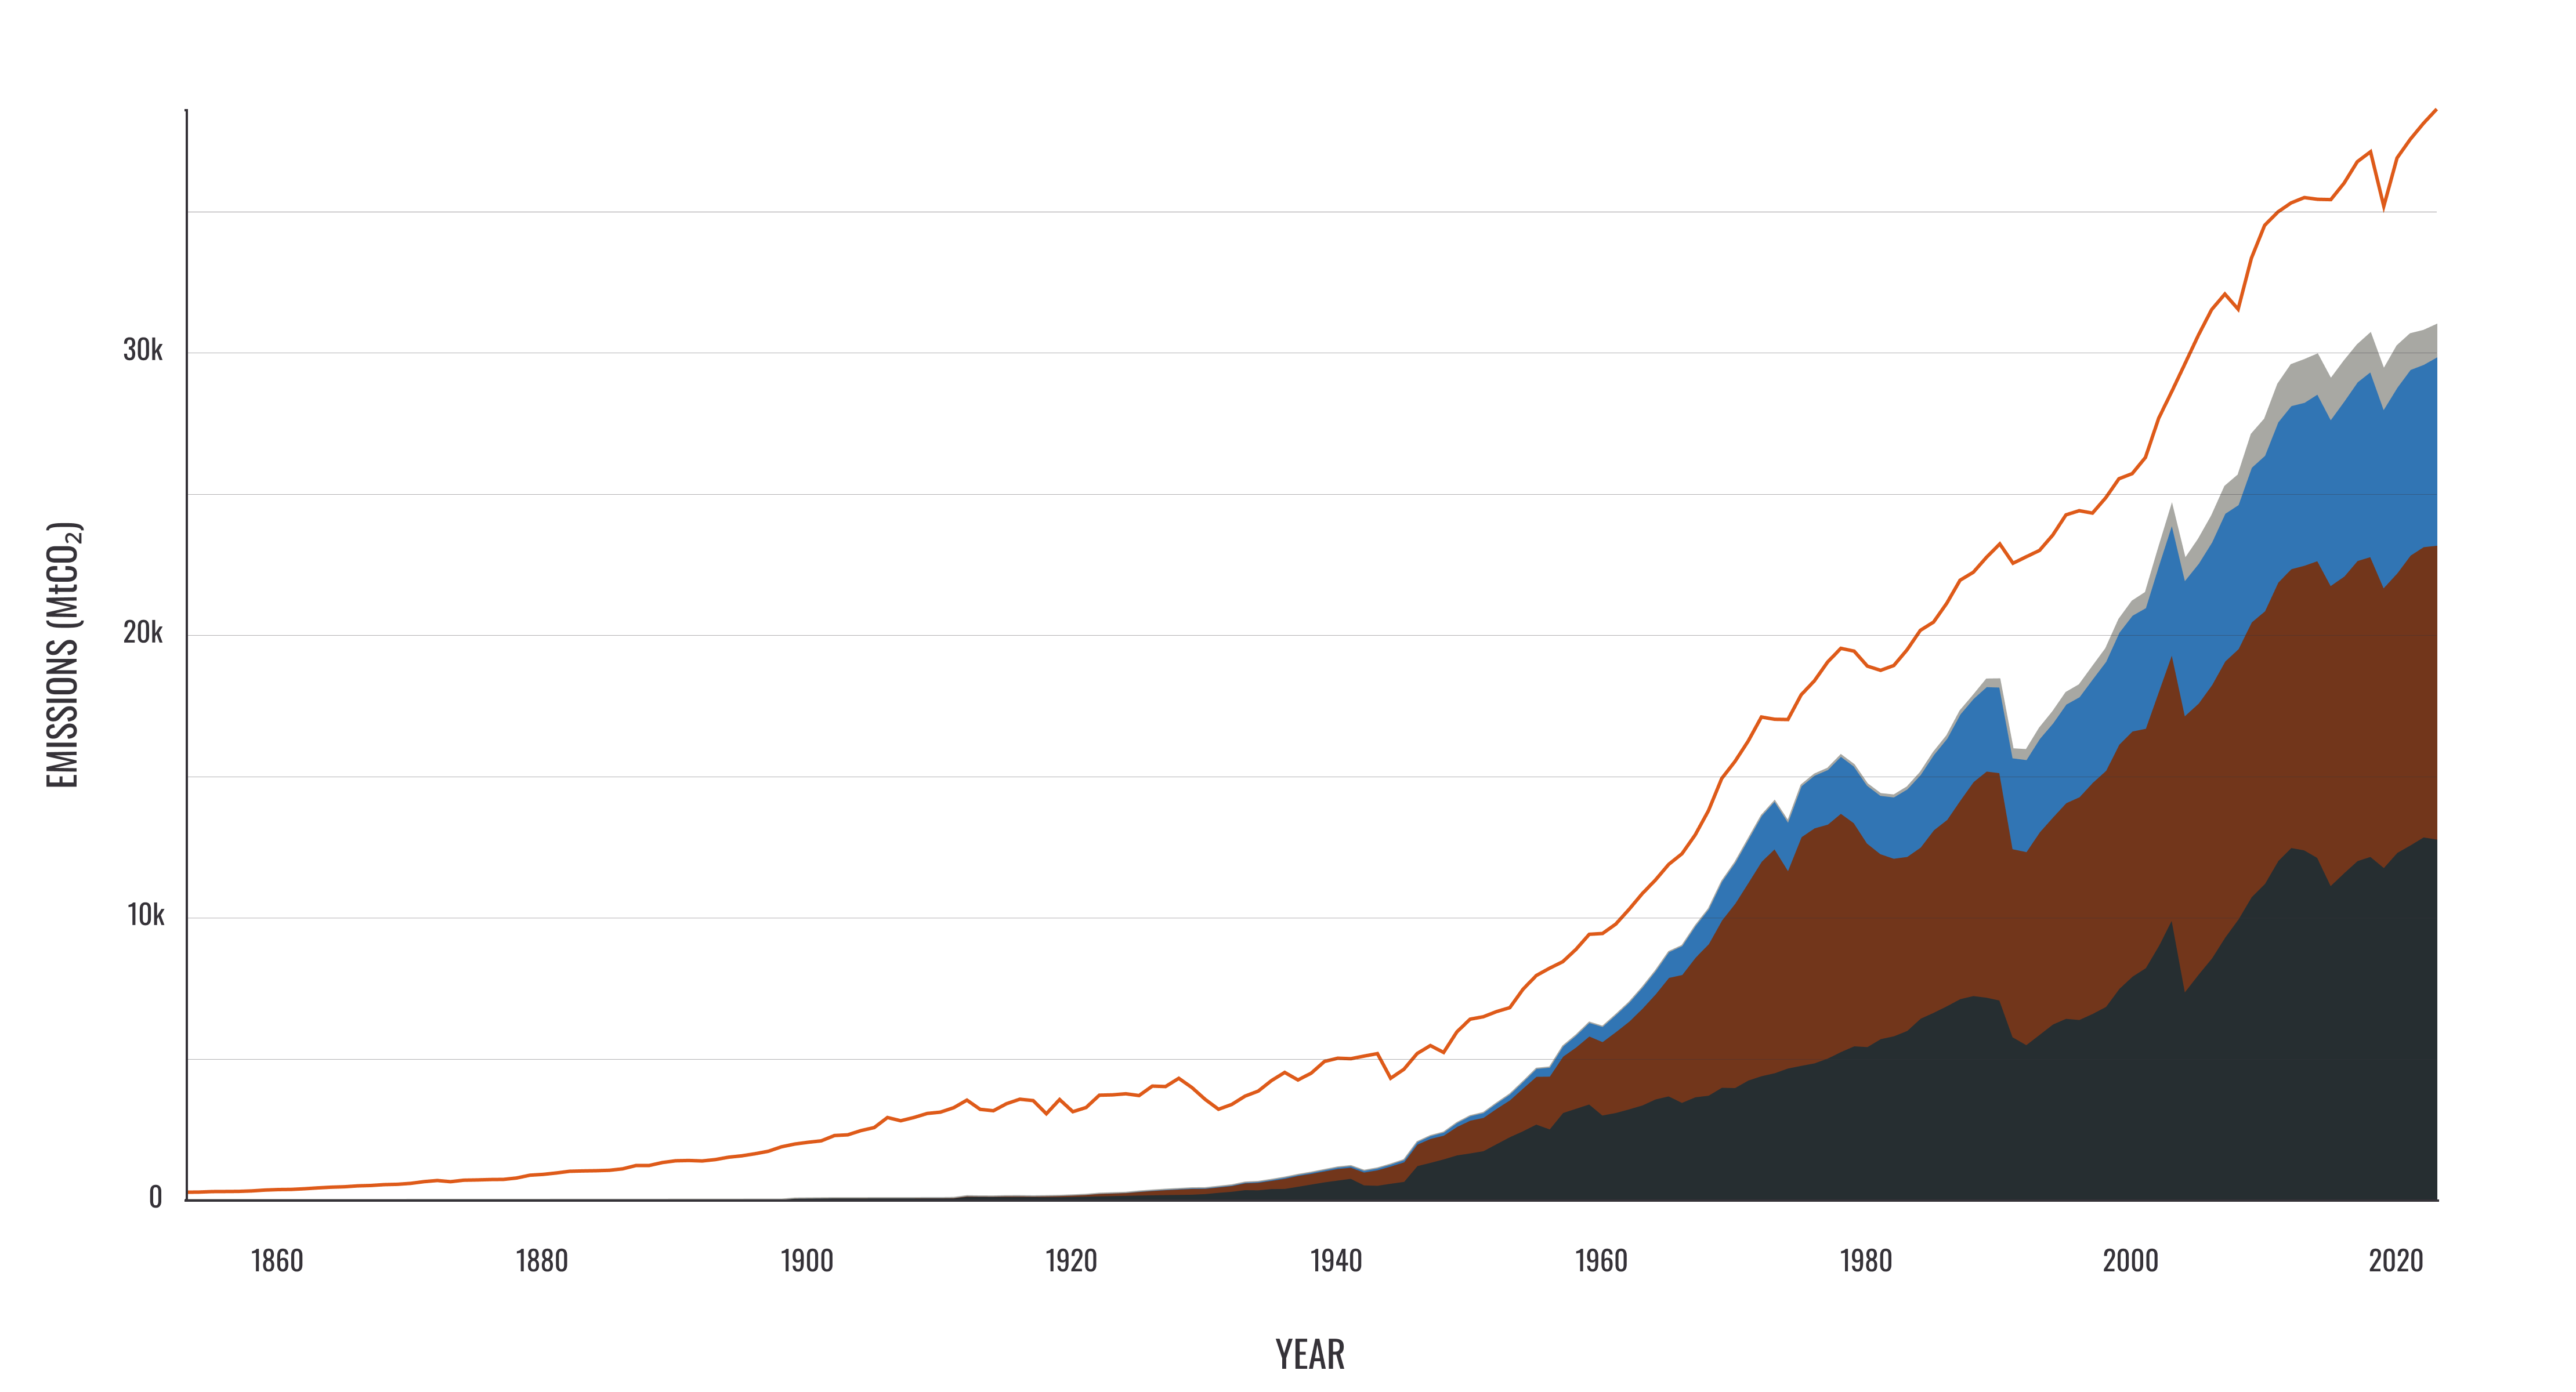
The following figure shows the annual CO2 emissions attributed to the carbon fuels and cement produced by Carbon Majors entities from the beginning of the data records in 1854 to 2024, and compares these to global fossil fuel and cement CO2 emissions.
In 2024, Carbon Majors traced emissions totalling 34.7 GtCO2e to the 166 active entities in the database, an increase of 0.8% compared to 2023. The CO2 emissions tracked account for 80% of global fossil fuel and cement CO2 emissions in 2024. More than half of these global emissions can be traced to just 32 state- and investor-owned companies, highlighting the concentration of emissions among the largest corporate emitters.
The table below highlights the top 20 highest carbon-emitting entities in 2024. Together, they were responsible for 18 GtCO2e, representing 41.8% of global fossil fuel and cement CO2 emissions in 2024. The list is largely dominated by state-owned entities, which account for 16 of the top 20. Notably, 8 of the top 20 entities are Chinese. Coal producers are particularly prominent, with seven represented, six from China and one from India, underscoring Asia’s continued dependence on coal.
| Entity | Total emissions (MtCO2e) | CO2 emissions (MtCO2) | Percentage of global CO2 emissions |
|---|---|---|---|
| Saudi Aramco | 1,786 | 1,653 | 4.28% |
| Coal India | 1,684 | 1,513 | 3.92% |
| CHN Energy | 1,679 | 1,509 | 3.91% |
| National Iranian Oil Company | 1,387 | 1,208 | 3.13% |
| Gazprom | 1,293 | 1,065 | 2.76% |
| Jinneng Group | 1,129 | 1,014 | 2.63% |
| China (Cement) | 950 | 950 | 2.46% |
| Rosneft | 763 | 690 | 1.79% |
| CNPC | 750 | 655 | 1.70% |
| Shandong Energy | 750 | 674 | 1.74% |
| China National Coal Group | 732 | 657 | 1.70% |
| Shaanxi Coal and Chemical Industry Group | 694 | 624 | 1.62% |
| ExxonMobil | 677 | 610 | 1.58% |
| Abu Dhabi National Oil Company (ADNOC) | 622 | 564 | 1.46% |
| Chevron | 577 | 512 | 1.33% |
| Sonatrach | 576 | 488 | 1.26% |
| Iraq National Oil Company | 549 | 518 | 1.34% |
| Shanxi Coking Coal Group | 540 | 486 | 1.26% |
| QatarEnergy | 446 | 369 | 0.96% |
| Shell | 426 | 373 | 0.97% |
Note: The total emissions values in the table above includes fugitive methane emissions in MtCO2 equivalent units, however only total CO2 figures are factored into the calculation of an entity's percentage of total fossil fuel and cement emissions.
Carbon Majors traces 1,436 GtCO2e of cumulative historical emissions from 1854 through 2024 to 178 industrial producers. The CO2 portion of this total is equivalent to 70% of global fossil fuel and cement CO2 emissions since the start of the Industrial Revolution in 1750. Over a third of these global CO2 emissions historically can be attributed to just 22 companies.
The table below shows the top 20 highest carbon producing entities in the database, which collectively account for 872 GtCO2e, representing 42.5% of global historical fossil fuel and cement CO2 emissions since 1824. The entities in positions 1 to 11 remain unchanged from last year. Significant changes to the top 20 include:
| Entity | Total emissions (MtCO2e) | CO2 emissions (MtCO2) | Percentage of global CO2 emissions |
|---|---|---|---|
| Former Soviet Union (1900–1991) | 135,113 | 120,875 | 6.54% |
| China (Coal, 1945–2004) | 104,888 | 94,242 | 5.10% |
| Saudi Aramco | 72,457 | 67,708 | 3.66% |
| Chevron | 62,503 | 56,915 | 3.08% |
| ExxonMobil | 57,458 | 51,653 | 2.79% |
| Gazprom | 53,116 | 43,034 | 2.33% |
| National Iranian Oil Company | 45,826 | 41,645 | 2.25% |
| BP | 43,231 | 39,397 | 2.13% |
| Shell | 41,517 | 37,267 | 2.02% |
| Coal India | 35,221 | 31,646 | 1.71% |
| Pemex | 26,458 | 24,180 | 1.31% |
| CHN Energy | 25,231 | 22,670 | 1.23% |
| China (Cement) | 25,111 | 25,111 | 1.36% |
| ConocoPhillips | 24,713 | 21,944 | 1.19% |
| Poland (Coal, 1913–2001) | 22,695 | 20,392 | 1.10% |
| CNPC | 20,434 | 18,491 | 1.00% |
| British Coal Corporation (1947–1994) | 19,745 | 17,741 | 0.96% |
| Core Natural Resources | 19,189 | 17,229 | 0.93% |
| TotalEnergies | 18,572 | 16,819 | 0.91% |
| Abu Dhabi National Oil Company (ADNOC) | 18,480 | 16,925 | 0.92% |
Note: The total emissions values in the table above includes fugitive methane emissions in MtCO2 equivalent units, however only total CO2 figures are factored into the calculation of an entity's percentage of total fossil fuel and cement emissions.
Emissions from the assessed entities are attributed to three types of producers: investor-owned companies, state-owned companies, and nation-state producers. Nation-state producers are included primarily in the coal sector, and only when investor-owned or state-owned companies are not established, play a minor role in the country, or lack sufficient historical production data.
Of the 178 entities assessed, 100 are investor-owned, 72 are state-owned, and 6 are nation-state producers. State-owned companies are the largest contributors to cumulative emissions, despite the greater number of investor-owned companies. Historically, the assessed state-owned companies account for 31.0% of global fossil CO2 emissions, the investor-owned companies for 24.1% and the nation-state producers for 14.8%.
In 2024, this pattern is even more pronounced. The 70 active state-owned companies are linked to 53.4% of global fossil CO2 emissions, compared with 94 investor-owned companies accounting for 23.7% and 2 nation-state producers accounting for 2.6%. This distribution reflects the increasing dominance of state-owned producers in major fossil fuel sectors. Comparing 2024 emissions to 2023, most state-owned companies increased their emissions, with 38 rising and 29 declining. In contrast, among investor-owned companies, more entities reduced emissions, with 54 decreasing and 39 increasing.
The top 5 investor-owned companies, ExxonMobil, Chevron, Shell, BP, and ConocoPhillips, are responsible for a significant portion of global emissions in 2024, with a total of 2.4 GtCO2e (5.5% of global fossil CO2 emissions). However, this is still considerably lower than the 7.8 GtCO2e (18.0% of global fossil CO2 emissions) linked to the 5 largest state-owned entities in 2024: Saudi Aramco, Coal India, CHN Energy, National Iranian Oil Co., and Gazprom.
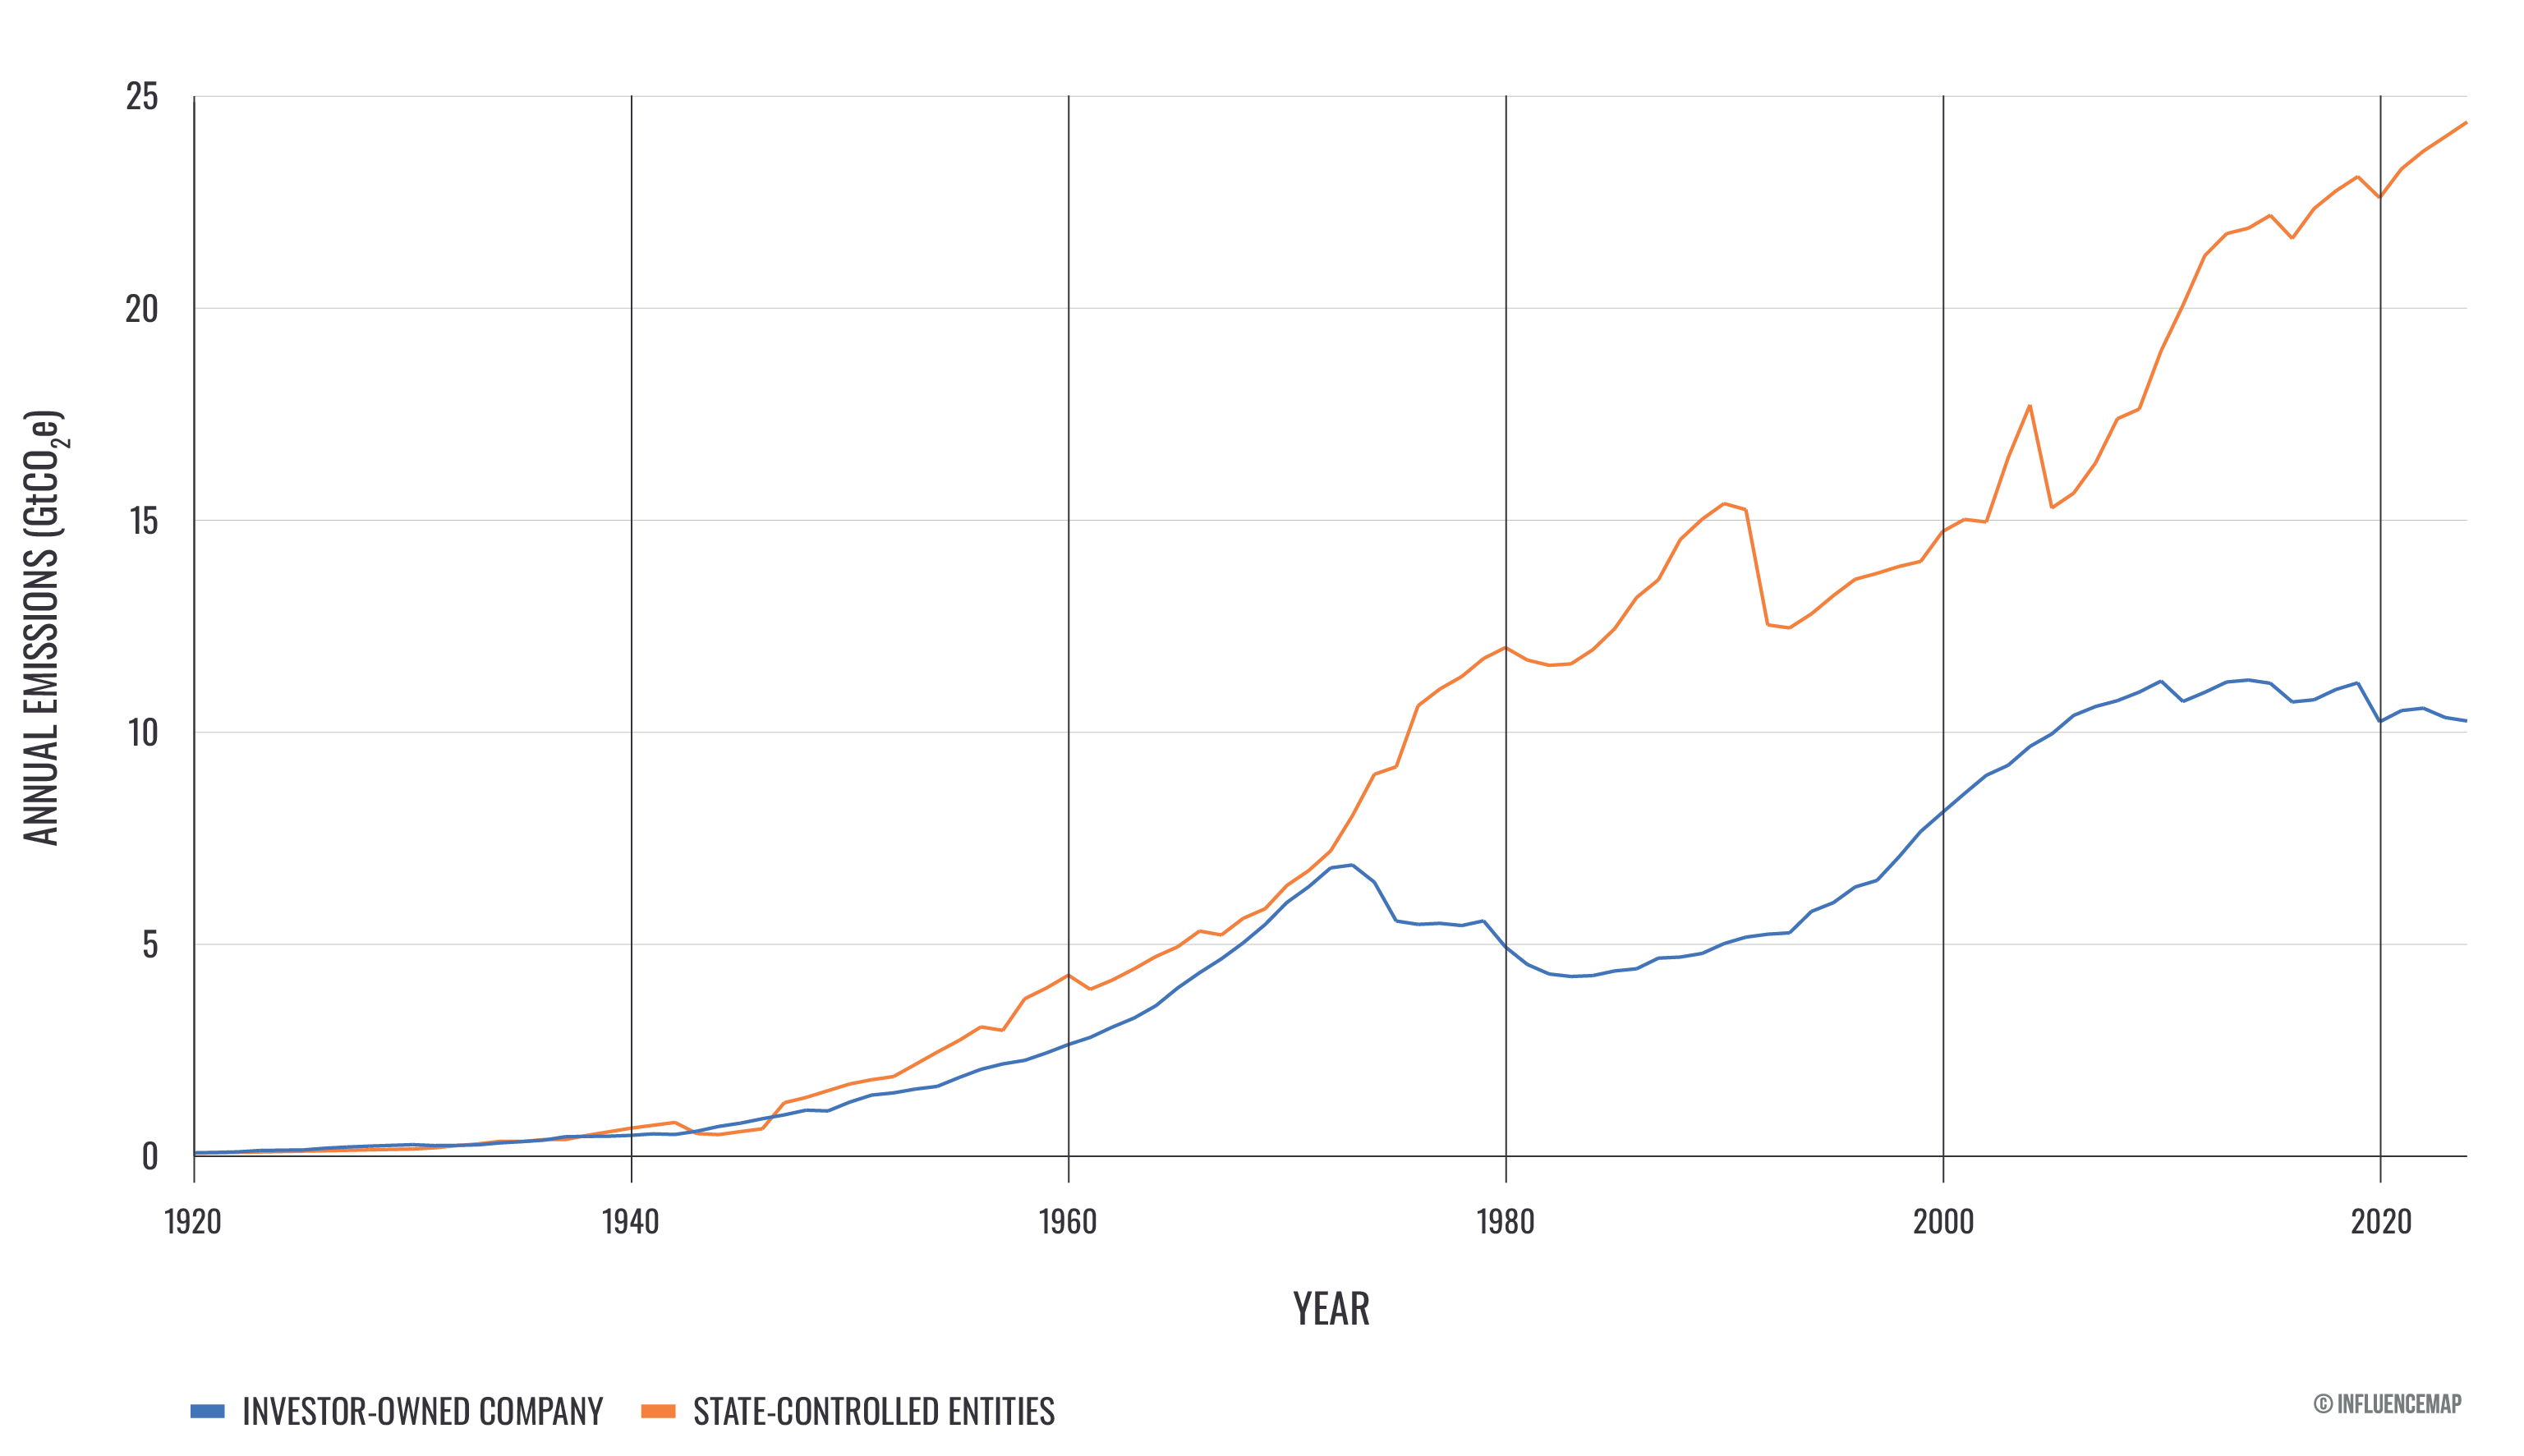
Up until around 2011, investor-owned companies were the largest single group in terms of cumulative emissions. Since then, state-owned companies have surpassed investor-owned companies. However, as shown in the graph below, combining state-owned companies and nation-state producers to assess all state-controlled production shows that these entities have consistently accounted for more emissions than investor-owned companies since the 1950s. While investor-owned company emissions dipped in the 1970s during the oil crisis and only recovered in the 1990s, state-controlled emissions have exhibited steady growth across the decades.
The drop in state-controlled emissions after 1991 reflects the disaggregation of Soviet Union production data into individual company records in the Carbon Majors methodology, combined with incomplete company-level data and an actual decline in output during the transition from the USSR to the Russian Federation. Similarly, the spike between 2002 and 2005 is driven by China’s rapid production increase in 2003–2004 followed by the disaggregation of national coal production data in the Carbon Majors database into individual Chinese coal companies, whose early historical data do not fully capture total Chinese coal output.
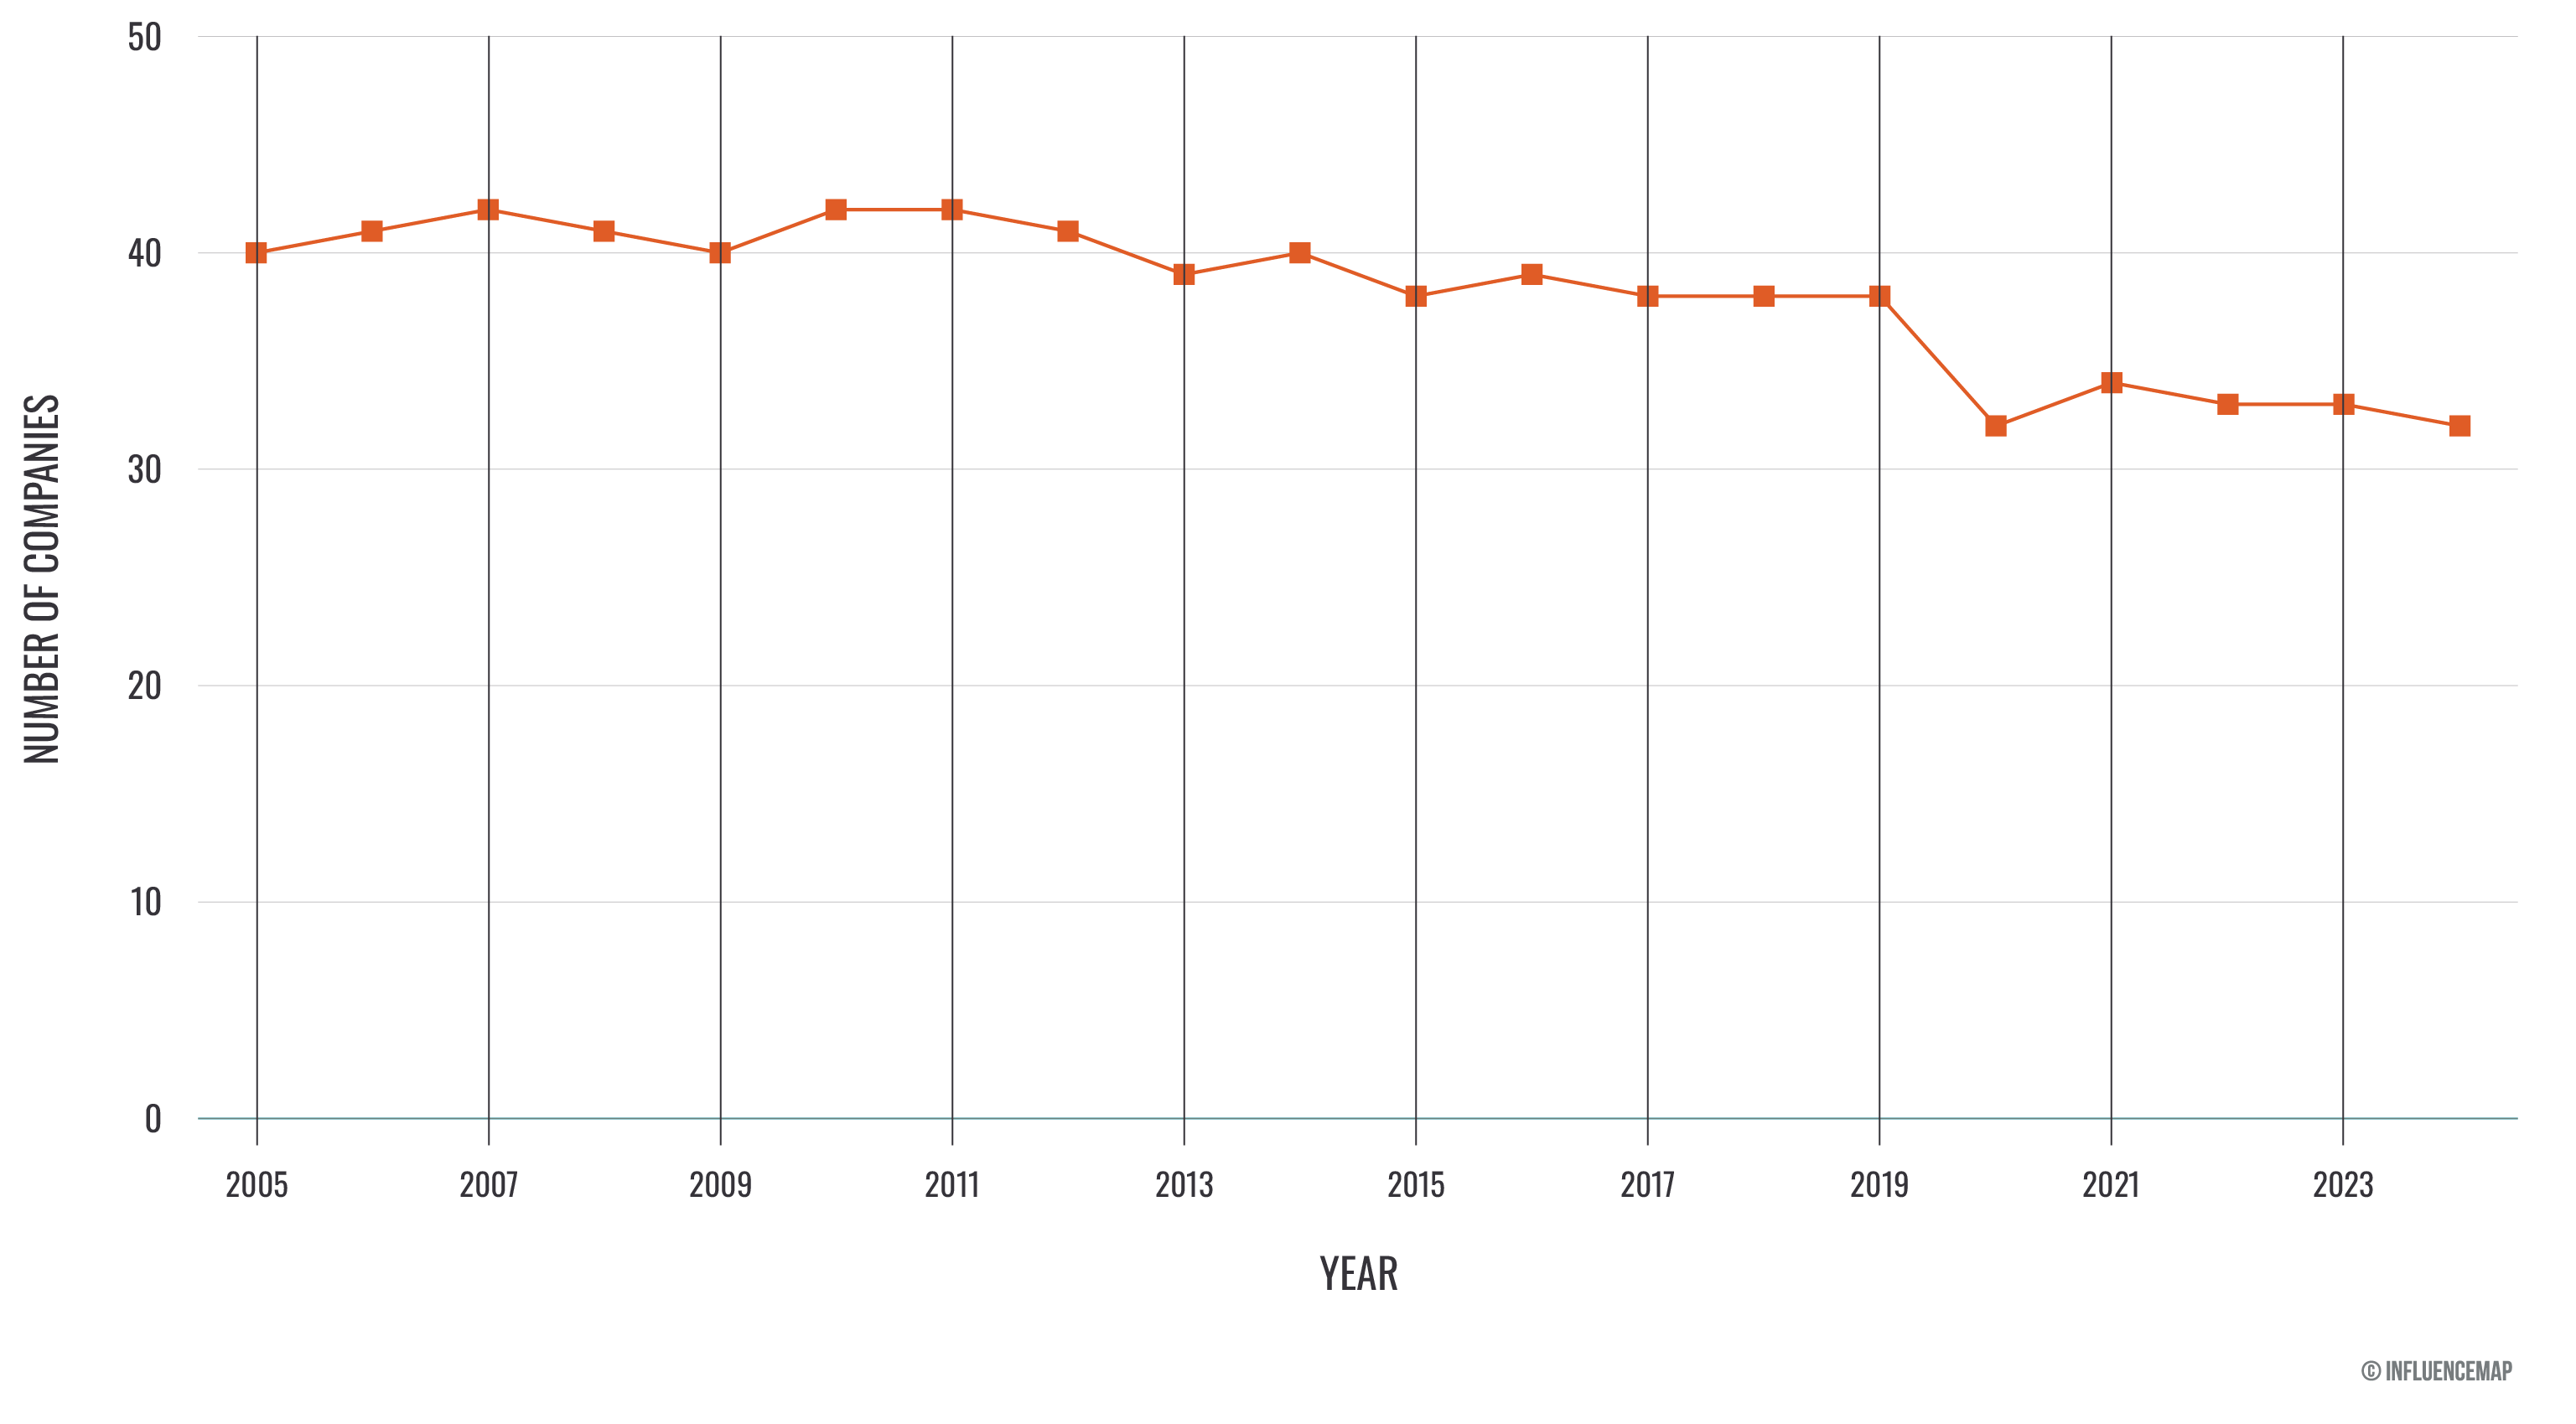
Previous Carbon Majors releases have highlighted how responsibility for emissions is highly concentrated among a small number of corporate producers. Historically, this is clear: over half of global CO2 emissions from 1750 to 2024 can be attributed to just 81 companies. Figure 4 below illustrates how this concentration has intensified over time. In 2024, over half of fossil CO2 emissions can be traced to just 32 state- and investor-owned companies, down from 38 companies five years earlier and consistently above 40 companies between 2005 and 2013. The large drop in 2020 reflects the sharp decline in global emissions during the COVID-19 pandemic. While total emissions from the carbon majors fell slightly that year, most of the reduction came from smaller companies rather than the largest emitters. In fact, the 32 companies responsible for over half of global emissions in 2020 collectively increased their emissions compared to 2019. Smaller producers recovered in 2021 to approximately pre-pandemic levels while the largest emitters continued increasing their emissions.
Since 2005, the oil, gas, and coal sectors have undergone significant changes, with both (i) mergers and acquisitions and (ii) organic production growth driving greater concentration of carbon emissions among fewer producers.
Notable mergers and acquisitions since 2005 include:
Analysis of year-on-year trends in 2024 shows mixed performance among companies. Overall, 83 companies decreased emissions, while 77 increased them, and 4 maintained the same level of emissions. However, the largest companies generally drove the upward trend: almost two thirds of the 32 companies responsible for over half of global emissions in 2024 increased emissions compared to 2023. Only 28% of the bottom half of the ranked entities saw increases, compared with 66% of the top half, highlighting that growth in emissions is concentrated among the largest producers. This pattern of concentration reflects both merger-driven and organic production growth. Under the Carbon Majors methodology, historical production from acquired companies is fully attributed to the acquiring company, meaning mergers and acquisitions consolidate past emissions into larger entities. However, the continued rise in emissions among the largest producers also points to substantial organic expansion of their own production capacity. Overall, the persistence of growth at the top of the ranking suggests that rising concentration is driven not only by corporate consolidation, but also by sustained output growth among the largest companies themselves and, in some cases, by the acquisition of already rapidly expanding producers.
This section analyzes the emissions of both investor-owned and state-owned companies by region, categorizing these entities based on the location of their headquarters: Africa, Asia, Australia, Europe, the Middle East, North America, and South America.
The data highlights clear regional disparities among the top fossil fuel and cement producers. All regions increased emissions from 2023 to 2024, but Asian companies stand out overwhelmingly, contributing 31.9% of global fossil CO2 emissions in 2024, with over 81% coming from coal. Their 2.2% increase is significant given its massive baseline, and the fact that over half of major Asian companies (58%) increased their emissions in 2024 compared to 2023. The 31 Chinese companies alone account for 22.8% of the global total, while India’s six companies were responsible for 5.2%, leaving the remaining 13 Asian companies responsible for 3.8%.
European and North American companies, although responsible for smaller shares (15.2% and 11.2% respectively), also saw notable proportional emissions increases of 3.1% and 2.3%. However, the majority of companies from both regions decreased emissions, again implying increased concentration of emissions among the largest producers in these regions. The Middle East is notable for different reasons: while companies in the region account for 12.9% of global emissions—a comparable share to Europe and North America—these are linked to only 10 companies compared to 50 companies in Europe and 37 in North America.
Smaller-emitting regions present their own concerns. African and South American companies each contribute less than 4% to global emissions, but Afica saw the highest proportional increase of 4.8%, while in South America, only one of the five assessed companies did not increase emissions.
| Region | Total 2024 emissions (MtCO2e) | Percentage of global CO2 emissions | Companies with increased emissions | Emissions change from 2023 |
|---|---|---|---|---|
| Africa | 1,675 | 3.8% | 3 of 8 (38%) | +4.8% |
| Asia | 13,775 | 31.9% | 29 of 50 (58%) | +2.2% |
| Australia | 274 | 0.6% | 2 of 4 (50%) | +1.5% |
| Europe | 6,682 | 15.2% | 20 of 50 (40%) | +3.1% |
| Middle East | 5,537 | 12.9% | 6 of 10 (60%) | +3.0% |
| North America | 4,856 | 11.2% | 17 of 37 (46%) | +2.3% |
| South America | 847 | 2.0% | 4 of 5 (80%) | +1.4% |
Many of the companies tracked by Carbon Majors are among the most oppositional companies to climate regulation globally, as shown by InfluenceMap’s LobbyMap database. The LobbyMap database scores and ranks over 1000 companies and 330 industry associations on their activities influencing climate change policy using an A+ to F scale.
As shown in the table below, LobbyMap assesses 9 of the 10 highest-emission investor-owned Carbon Majors companies. Of these 9 companies, 5 score a D or below, indicating unsupportive positions on climate policy. The remaining 4 score only slightly higher at C or C-. 8 out of 9 assessed companies have an engagement intensity score above 24%, indicating active engagement with climate policy. For example, Chevron scores an D- with an engagement intensity of 33%, and ExxonMobil scores a D with an engagement intensity of 39%, indicating that both companies are highly engaged with and hold unsupportive or oppositional positions on climate-related policy.
| Investor-owned company | Performance band | Engagement intensity |
|---|---|---|
| Chevron | D- | 33% |
| ExxonMobil | D | 39% |
| BP | C- | 52% |
| Shell | C- | 54% |
| ConocoPhillips | E+ | 26% |
| Core Natural Resources | - | - |
| TotalEnergies | C- | 38% |
| Peabody Energy | F | 6% |
| Occidental Petroleum | D- | 24% |
| BHP | C | 33% |
State-owned companies are even more oppositional to climate regulation globally according to LobbyMap research. LobbyMap assesses 7 of the 10 highest emitting state-owned Carbon Majors companies. Similarly to investor-owned companies, none scores higher than a C-, while 5 receive scores lower or equal to a D, where D to F indicates increasingly obstructive climate policy engagement.
State-owned companies are also not as transparently engaged as investor-owned companies. The 6 assessed state-owned companies average a 13% engagement intensity compared to 34% for investor-owned companies. Saudi Aramco's D- score with an engagement intensity of 10% is representative of these companies, indicating oppositional positions on climate policy with active engagement.
| State-owned company | Performance band | Engagement intensity |
|---|---|---|
| Saudi Aramco | D- | 10% |
| Gazprom | E | 9% |
| National Iranian Oil Company | - | - |
| Coal India | D | 9% |
| Pemex | D- | 16% |
| CHN Energy (Shenhua Energy) | C- | 12% |
| CNPC (PetroChina) | C- | 25% |
| British Coal Corporation | - | - |
| Abu Dhabi National Oil Company (ADNOC) | D | 12% |
| Petroleos de Venezuela | - | - |
This analysis highlights the concentrated responsibility for global carbon emissions and underscores the critical role of corporate accountability in combating climate change. Historically, 70% of global fossil fuel and cement CO₂ emissions from 1854 through 2024 can be traced to 178 producing entities, with over a third attributeable to just 22 companies. This demonstrates a clear concentration of responsibility among a relatively small number of producers. In recent years, the importance of corporate accountability has grown, particularly as international climate commitments have been unevenly implemented and, in some regions, partially rolled back. Carbon Majors provides a critical foundation for scientific attribution and climate liability, linking emissions directly to individual companies and supporting efforts to hold them responsible for environmental and social harms.
In 2024, the database traced 34.7 GtCO2e of emissions to 166 active entities, a 0.8% increase from 2023. Just 32 companies, state- and investor-owned, were responsible for over half of global fossil fuel and cement emissions, down from 38 companies five years earlier and consistently above 40 companies between 2005 and 2013, reflecting an intensifying concentration of emissions among the largest producers. State-owned companies now dominate, accounting for 53.4% of global fossil CO2 emissions in 2024, compared with 23.7% for investor-owned companies, and comprising 16 of the top 20 emitters. Most state-owned companies increased their emissions from 2023, while a greater proportion of investor-owned companies reduced theirs, highlighting the structural shift in global fossil fuel production toward state ownership.
The concentration of emissions among a small number of companies has direct implications for climate accountability. Just as in previous years, the largest producers continue to drive growth in emissions: only 28% of the bottom half of the ranked entities saw increases, compared with 66% of the top half. This pattern of concentration is driven by both mergers and organic production growth, indicating that rising concentration is driven not only by corporate consolidation but also by sustained output growth among the largest companies themselves. This growing concentration strengthens the case for targeted legal and policy interventions, as a limited number of companies are responsible for a disproportionate share of global emissions.
In summary, the Carbon Majors database provides a comprehensive view of both historical and contemporary emissions, revealing how a small number of companies shape global carbon totals. By making corporate responsibility measurable, it supports legal, policy, and scientific efforts to mitigate climate change and underscores the urgent need for targeted interventions and systemic reforms to align industrial production with global climate goals and limit future warming.
The emissions column in the table below includes four direct production-linked operational emission types (comprising part of Scope 1 emissions) and emissions from the combustion of marketed products (categorized as Scope 3 Category 11: Use of Sold Products). One of the four direct emission types is fugitive methane (see the Methodology Page for more information), given in CO2 equivalent units. In the final column, Percentage of global CO2 emissions, the value for fugitive methane is not considered when comparing an entity's total CO2 emissions to total fossil fuel and cement CO2 emissions.
| Entity | Total emissions (MtCO2e) | Percentage of global CO2 emissions | |
|---|---|---|---|
| 1 | Saudi Aramco | 1,786 | 4.28% |
| 2 | Coal India | 1,684 | 3.92% |
| 3 | CHN Energy | 1,679 | 3.91% |
| 4 | National Iranian Oil Company | 1,387 | 3.13% |
| 5 | Gazprom | 1,293 | 2.76% |
| 6 | Jinneng Group | 1,129 | 2.63% |
| 7 | China (Cement) | 950 | 2.46% |
| 8 | Rosneft | 763 | 1.79% |
| 9 | CNPC | 750 | 1.70% |
| 10 | Shandong Energy | 750 | 1.74% |
| 11 | China National Coal Group | 732 | 1.70% |
| 12 | Shaanxi Coal and Chemical Industry Group | 694 | 1.62% |
| 13 | ExxonMobil | 677 | 1.58% |
| 14 | Abu Dhabi National Oil Company | 622 | 1.46% |
| 15 | Chevron | 577 | 1.33% |
| 16 | Sonatrach | 576 | 1.26% |
| 17 | Iraq National Oil Company | 549 | 1.34% |
| 18 | Shanxi Coking Coal Group | 540 | 1.26% |
| 19 | QatarEnergy | 446 | 0.96% |
| 20 | Shell | 426 | 0.97% |
| 21 | Kuwait Petroleum Corp. | 419 | 1.01% |
| 22 | Petrobras | 400 | 0.95% |
| 23 | Pemex | 378 | 0.88% |
| 24 | BP | 354 | 0.80% |
| 25 | ConocoPhillips | 352 | 0.82% |
| 26 | TotalEnergies | 352 | 0.81% |
| 27 | Nigerian National Petroleum Corp. | 337 | 0.78% |
| 28 | Glencore | 332 | 0.77% |
| 29 | Lukoil | 323 | 0.76% |
| 30 | China Huaneng Group | 300 | 0.70% |
| 31 | Equinor | 296 | 0.67% |
| 32 | CNOOC | 293 | 0.69% |
| 33 | Peabody Energy | 261 | 0.61% |
| 34 | Petronas | 260 | 0.57% |
| 35 | Luan Chemical Group | 259 | 0.60% |
| 36 | Novatek | 257 | 0.55% |
| 37 | SUEK | 256 | 0.60% |
| 38 | Eni | 243 | 0.55% |
| 39 | TurkmenGaz | 237 | 0.50% |
| 40 | State Power Investment Corporation | 219 | 0.51% |
| 41 | Sinopec | 214 | 0.49% |
| 42 | Samruk-Kazyna | 213 | 0.50% |
| 43 | Liaoning Energy Industry Holding Group | 209 | 0.49% |
| 44 | Occidental Petroleum | 209 | 0.49% |
| 45 | Canadian Natural Resources | 204 | 0.48% |
| 46 | Xinjiang Tianchi Energy | 201 | 0.47% |
| 47 | Henan Energy and Chemical Industry Group | 198 | 0.46% |
| 48 | Petroleos de Venezuela | 192 | 0.45% |
| 49 | Huaihe Energy Holding Group | 190 | 0.44% |
| 50 | Expand Energy | 181 | 0.38% |
| 51 | Core Natural Resources | 181 | 0.42% |
| 52 | Bumi Resources | 177 | 0.41% |
| 53 | Sonangol | 174 | 0.42% |
| 54 | Surgutneftegas | 173 | 0.42% |
| 55 | Huadian Coal Industry Group | 170 | 0.40% |
| 56 | Petroleum Development Oman | 168 | 0.39% |
| 57 | EQT Corporation | 162 | 0.34% |
| 58 | EOG Resources | 159 | 0.37% |
| 59 | Inner Mongolia Yitai Group | 158 | 0.37% |
| 60 | Petoro | 158 | 0.35% |
| 61 | Jizhong Energy Resources | 157 | 0.37% |
| 62 | Pertamina | 157 | 0.36% |
| 63 | AlamTri Resources | 153 | 0.36% |
| 64 | Libya National Oil Corp. | 150 | 0.36% |
| 65 | Heilongjiang Longmay Mining Holding Group | 139 | 0.32% |
| 66 | Adani Group | 139 | 0.33% |
| 67 | Singareni Collieries | 138 | 0.32% |
| 68 | Seriti Resources | 134 | 0.31% |
| 69 | Inner Mongolia Dian Tou Energy | 130 | 0.30% |
| 70 | Inner Mongolia Huineng Coal and Electricity Group | 126 | 0.29% |
| 71 | Suncor Energy | 120 | 0.30% |
| 72 | Cenovus Energy | 119 | 0.28% |
| 73 | Kuzbassrazrezugol | 118 | 0.27% |
| 74 | ONGC | 115 | 0.26% |
| 75 | PTTEP | 112 | 0.24% |
| 76 | Egyptian General Petroleum | 112 | 0.25% |
| 77 | Huayang New Material Technology Group | 112 | 0.26% |
| 78 | Devon Energy | 110 | 0.26% |
| 79 | Banpu | 110 | 0.25% |
| 80 | Ecopetrol | 110 | 0.26% |
| 81 | NTPC | 108 | 0.25% |
| 82 | Coterra Energy | 105 | 0.23% |
| 83 | BHP | 103 | 0.24% |
| 84 | Diamondback Energy | 102 | 0.24% |
| 85 | Sasol | 97 | 0.22% |
| 86 | Exxaro Resources Ltd | 95 | 0.22% |
| 87 | Bapco Energies | 95 | 0.21% |
| 88 | Mitsubishi Corporation | 92 | 0.21% |
| 89 | Kailuan Group | 91 | 0.21% |
| 90 | Tourmaline Oil | 91 | 0.19% |
| 91 | INPEX | 90 | 0.21% |
| 92 | Ovintiv | 89 | 0.20% |
| 93 | Repsol | 89 | 0.19% |
| 94 | Antero Resources | 88 | 0.19% |
| 95 | Eurasian Resources Group | 88 | 0.20% |
| 96 | Elgaugol | 82 | 0.19% |
| 97 | Tatneft | 82 | 0.20% |
| 98 | Alliance Resource Partners | 81 | 0.19% |
| 99 | Woodside Energy | 79 | 0.17% |
| 100 | China Pingmei Shenma Holding Group | 79 | 0.18% |
| 101 | YPF | 75 | 0.17% |
| 102 | American Consolidated Natural Resources | 74 | 0.17% |
| 103 | Uzbekneftegaz | 72 | 0.15% |
| 104 | Navajo Transitional Energy Company | 72 | 0.17% |
| 105 | PetroEcuador | 70 | 0.17% |
| 106 | APA Corporation | 68 | 0.16% |
| 107 | Continental Resources | 65 | 0.15% |
| 108 | Sibanthracite Group | 62 | 0.14% |
| 109 | North Korea | 61 | 0.14% |
| 110 | RWE | 59 | 0.14% |
| 111 | Whitehaven Coal | 57 | 0.13% |
| 112 | Inner Mongolia Mengtai Group | 57 | 0.13% |
| 113 | Mubadala | 56 | 0.13% |
| 114 | Huaibei Mining Group | 56 | 0.13% |
| 115 | Huating Coal Industry Group | 55 | 0.13% |
| 116 | EVRAZ | 55 | 0.13% |
| 117 | Inner Mongolia Yidong Resources Group | 54 | 0.13% |
| 118 | ARC Resources | 54 | 0.12% |
| 119 | UltraTech Cement | 53 | 0.14% |
| 120 | PGE Group | 52 | 0.12% |
| 121 | OMV | 51 | 0.12% |
| 122 | Xuzhou Mining Group | 50 | 0.12% |
| 123 | DTEK | 50 | 0.11% |
| 124 | Anglo American | 47 | 0.11% |
| 125 | Polska Grupa Gornicza (PGG) | 46 | 0.11% |
| 126 | Holcim Group | 46 | 0.12% |
| 127 | Stroyservis | 42 | 0.10% |
| 128 | Guizhou Panjiang Coal Power Group | 42 | 0.10% |
| 129 | Alpha Metallurgical Resources | 42 | 0.10% |
| 130 | En+ Group | 41 | 0.10% |
| 131 | Heidelberg Materials | 40 | 0.10% |
| 132 | CNX Resources | 40 | 0.08% |
| 133 | Teck Resources | 37 | 0.09% |
| 134 | Naftogaz | 36 | 0.07% |
| 135 | Santos | 34 | 0.07% |
| 136 | BASF | 34 | 0.07% |
| 137 | JSW | 34 | 0.08% |
| 138 | Orlen | 32 | 0.07% |
| 139 | NACCO Industries | 31 | 0.07% |
| 140 | SDS Coal | 30 | 0.07% |
| 141 | Murphy Oil | 28 | 0.06% |
| 142 | Mechel | 28 | 0.07% |
| 143 | SM Energy | 28 | 0.06% |
| 144 | Severstal | 25 | 0.06% |
| 145 | Novaya Gornaya | 24 | 0.06% |
| 146 | Russian Coal | 24 | 0.06% |
| 147 | LW Bogdanka | 21 | 0.05% |
| 148 | Kazakhmys Holding Group | 20 | 0.05% |
| 149 | TALTEK | 20 | 0.05% |
| 150 | Severoceske doly | 19 | 0.04% |
| 151 | Cemex | 17 | 0.04% |
| 152 | CRH | 15 | 0.04% |
| 153 | Wolverine Fuels | 15 | 0.04% |
| 154 | Kuzbasskaya Toplivnaya | 14 | 0.03% |
| 155 | Poludniowy Koncern Weglowy | 13 | 0.03% |
| 156 | Metinvest | 13 | 0.03% |
| 157 | Taiheiyo Cement | 12 | 0.03% |
| 158 | Westmoreland Mining | 12 | 0.03% |
| 159 | Kiewit Mining Group | 12 | 0.03% |
| 160 | Vistra | 11 | 0.03% |
| 161 | Syrian Petroleum | 10 | 0.02% |
| 162 | Sev.en Group | 9 | 0.02% |
| 163 | Tullow Oil | 9 | 0.02% |
| 164 | Obsidian Energy | 6 | 0.01% |
| 165 | OKD | 6 | 0.01% |
| 166 | Sokolovska uhelna | 3 | 0.01% |
The emissions column in the table below includes four direct production-linked operational emission types (comprising part of Scope 1 emissions) and emissions from the combustion of marketed products (categorized as Scope 3 Category 11: Use of Sold Products). One of the four direct emission types is fugitive methane (see the Methodology Page for more information), given in CO2 equivalent units. In the final column, Percentage of global CO2 emissions, the value for fugitive methane is not considered when comparing an entity's total CO2 emissions to total fossil fuel and cement CO2 emissions.
| Entity | Total emissions (MtCO2e) | Percentage of global CO2 emissions | |
|---|---|---|---|
| 1 | Former Soviet Union (1900-1991) | 135,113 | 6.54% |
| 2 | China (Coal, 1945-2004) | 104,888 | 5.10% |
| 3 | Saudi Aramco | 72,457 | 3.66% |
| 4 | Chevron | 62,503 | 3.08% |
| 5 | ExxonMobil | 57,458 | 2.79% |
| 6 | Gazprom | 53,116 | 2.33% |
| 7 | National Iranian Oil Company | 45,826 | 2.25% |
| 8 | BP | 43,231 | 2.13% |
| 9 | Shell | 41,517 | 2.02% |
| 10 | Coal India | 35,221 | 1.71% |
| 11 | Pemex | 26,458 | 1.31% |
| 12 | CHN Energy | 25,231 | 1.23% |
| 13 | China (Cement) | 25,111 | 1.36% |
| 14 | ConocoPhillips | 24,713 | 1.19% |
| 15 | Poland (Coal, 1913-2001) | 22,695 | 1.10% |
| 16 | CNPC | 20,434 | 1.00% |
| 17 | British Coal Corporation (1947-1994) | 19,745 | 0.96% |
| 18 | Core Natural Resources | 19,189 | 0.93% |
| 19 | TotalEnergies | 18,572 | 0.91% |
| 20 | Abu Dhabi National Oil Company | 18,480 | 0.92% |
| 21 | Peabody Energy | 18,283 | 0.89% |
| 22 | Petroleos de Venezuela | 17,265 | 0.86% |
| 23 | Kuwait Petroleum Corp. | 16,757 | 0.85% |
| 24 | Iraq National Oil Company | 16,390 | 0.84% |
| 25 | Rosneft | 16,340 | 0.82% |
| 26 | Sonatrach | 16,091 | 0.75% |
| 27 | Jinneng Group | 14,493 | 0.70% |
| 28 | Occidental Petroleum | 13,382 | 0.65% |
| 29 | Petrobras | 11,611 | 0.58% |
| 30 | Shandong Energy | 11,291 | 0.55% |
| 31 | BHP | 11,264 | 0.55% |
| 32 | Nigerian National Petroleum Corp. | 10,768 | 0.54% |
| 33 | China National Coal Group | 9,882 | 0.48% |
| 34 | Eni | 9,686 | 0.46% |
| 35 | Czechoslovakia (Coal, 1938-1992) | 9,618 | 0.47% |
| 36 | QatarEnergy | 9,348 | 0.44% |
| 37 | Petronas | 9,260 | 0.43% |
| 38 | Pertamina | 8,582 | 0.42% |
| 39 | Lukoil | 8,491 | 0.43% |
| 40 | Libya National Oil Corp. | 8,430 | 0.43% |
| 41 | Equinor | 8,332 | 0.40% |
| 42 | Anglo American | 8,260 | 0.40% |
| 43 | RWE | 7,708 | 0.37% |
| 44 | Shanxi Coking Coal Group | 7,556 | 0.37% |
| 45 | Shaanxi Coal and Chemical Industry Group | 7,414 | 0.36% |
| 46 | Glencore | 6,974 | 0.34% |
| 47 | Rio Tinto (1959-2018) | 6,767 | 0.33% |
| 48 | Alpha Metallurgical Resources | 6,215 | 0.30% |
| 49 | ONGC | 6,150 | 0.30% |
| 50 | SUEK | 5,331 | 0.26% |
| 51 | Sasol | 5,187 | 0.25% |
| 52 | Surgutneftegas | 5,090 | 0.26% |
| 53 | TurkmenGaz | 4,820 | 0.21% |
| 54 | Repsol | 4,766 | 0.23% |
| 55 | Petroleum Development Oman | 4,726 | 0.23% |
| 56 | CNOOC | 4,715 | 0.23% |
| 57 | North Korea | 4,653 | 0.23% |
| 58 | Egyptian General Petroleum | 4,559 | 0.22% |
| 59 | Petoro | 4,479 | 0.21% |
| 60 | Henan Energy and Chemical Industry Group | 4,387 | 0.21% |
| 61 | Sinopec | 4,373 | 0.22% |
| 62 | China Huaneng Group | 4,368 | 0.21% |
| 63 | Samruk-Kazyna | 4,315 | 0.21% |
| 64 | Luan Chemical Group | 4,178 | 0.20% |
| 65 | State Power Investment Corporation | 4,139 | 0.20% |
| 66 | Bumi Resources | 4,123 | 0.20% |
| 67 | Jizhong Energy Resources | 3,919 | 0.19% |
| 68 | Sonangol | 3,715 | 0.19% |
| 69 | Uzbekneftegaz | 3,610 | 0.16% |
| 70 | Novatek | 3,601 | 0.16% |
| 71 | Singareni Collieries | 3,569 | 0.17% |
| 72 | Devon Energy | 3,536 | 0.16% |
| 73 | Huaihe Energy Holding Group | 3,453 | 0.17% |
| 74 | Huayang New Material Technology Group | 3,391 | 0.16% |
| 75 | Ecopetrol | 3,314 | 0.17% |
| 76 | Suncor Energy | 3,301 | 0.17% |
| 77 | Holcim Group | 3,265 | 0.18% |
| 78 | Liaoning Energy Industry Holding Group | 3,177 | 0.15% |
| 79 | Ovintiv | 3,175 | 0.15% |
| 80 | Canadian Natural Resources | 3,078 | 0.15% |
| 81 | Expand Energy | 3,046 | 0.13% |
| 82 | Ukrainian Ministry of Energy (Coal, 1992-2012) | 2,885 | 0.14% |
| 83 | Kuzbassrazrezugol | 2,813 | 0.14% |
| 84 | Kailuan Group | 2,632 | 0.13% |
| 85 | Polska Grupa Gornicza (PGG) | 2,586 | 0.13% |
| 86 | Cyprus AMAX Minerals (1969-1998) | 2,569 | 0.12% |
| 87 | Heilongjiang Longmay Mining Holding Group | 2,562 | 0.12% |
| 88 | Inner Mongolia Yitai Group | 2,541 | 0.12% |
| 89 | American Consolidated Natural Resources | 2,437 | 0.12% |
| 90 | Westmoreland Mining | 2,404 | 0.12% |
| 91 | BASF | 2,398 | 0.11% |
| 92 | AlamTri Resources | 2,357 | 0.11% |
| 93 | Exxaro Resources Ltd | 2,345 | 0.11% |
| 94 | Bapco Energies | 2,317 | 0.11% |
| 95 | Inner Mongolia Dian Tou Energy | 2,227 | 0.11% |
| 96 | Cenovus Energy | 2,210 | 0.11% |
| 97 | Mitsubishi Corporation | 2,200 | 0.10% |
| 98 | APA Corporation | 2,193 | 0.10% |
| 99 | YPF | 2,186 | 0.10% |
| 100 | Banpu | 2,158 | v |
| 101 | China Pingmei Shenma Holding Group | 2,149 | 0.10% |
| 102 | Tatneft | 2,144 | 0.11% |
| 103 | Eurasian Resources Group | 2,143 | 0.10% |
| 104 | EOG Resources | 2,113 | 0.10% |
| 105 | PetroEcuador | 2,062 | 0.11% |
| 106 | Alliance Resource Partners | 1,945 | 0.09% |
| 107 | Heidelberg Materials | 1,764 | 0.10% |
| 108 | INPEX | 1,736 | 0.08% |
| 109 | Kiewit Mining Group | 1,723 | 0.08% |
| 110 | NACCO Industries | 1,707 | 0.08% |
| 111 | Inner Mongolia Huineng Coal and Electricity Group | 1,695 | 0.08% |
| 112 | Huadian Coal Industry Group | 1,694 | 0.08% |
| 113 | Syrian Petroleum | 1,651 | 0.08% |
| 114 | Teck Resources | 1,591 | 0.08% |
| 115 | Huaibei Mining Group | 1,533 | 0.07% |
| 116 | EVRAZ | 1,486 | 0.07% |
| 117 | Cloud Peak (2009-2019) | 1,476 | 0.07% |
| 118 | PGE Group | 1,433 | 0.07% |
| 119 | DTEK | 1,424 | 0.07% |
| 120 | Vistra | 1,416 | 0.07% |
| 121 | Coterra Energy | 1,393 | 0.06% |
| 122 | Mechel | 1,380 | 0.07% |
| 123 | Naftogaz | 1,322 | 0.06% |
| 124 | EQT Corporation | 1,309 | 0.06% |
| 125 | PTTEP | 1,294 | 0.06% |
| 126 | Inner Mongolia Yidong Resources Group | 1,276 | 0.06% |
| 127 | Guizhou Panjiang Coal Power Group | 1,234 | 0.06% |
| 128 | Xuzhou Mining Group | 1,175 | 0.06% |
| 129 | Inner Mongolia Mengtai Group | 1,151 | 0.06% |
| 130 | OMV | 1,120 | 0.05% |
| 131 | Diamondback Energy | 1,081 | 0.05% |
| 132 | Woodside Energy | 1,074 | 0.05% |
| 133 | Huating Coal Industry Group | 994 | 0.05% |
| 134 | Santos | 915 | 0.04% |
| 135 | En+ Group | 907 | 0.04% |
| 136 | Cemex | 905 | 0.05% |
| 137 | SDS Coal | 901 | 0.04% |
| 138 | UK Coal (1995-2015) | 882 | 0.04% |
| 139 | Tourmaline Oil | 881 | 0.04% |
| 140 | JSW | 853 | 0.04% |
| 141 | Murphy Oil | 822 | 0.04% |
| 142 | Orlen | 806 | 0.04% |
| 143 | Mubadala | 791 | 0.04% |
| 144 | Antero Resources | 782 | 0.04% |
| 145 | Severstal | 748 | 0.04% |
| 146 | Novaya Gornaya | 675 | 0.03% |
| 147 | Xinjiang Tianchi Energy | 649 | 0.03% |
| 148 | Metinvest | 646 | 0.03% |
| 149 | ARC Resources | 640 | 0.03% |
| 150 | Seriti Resources | 608 | 0.03% |
| 151 | Taiheiyo Cement | 605 | 0.03% |
| 152 | Russian Coal | 598 | 0.03% |
| 153 | Continental Resources | 587 | 0.03% |
| 154 | Adani Group | 576 | 0.03% |
| 155 | Navajo Transitional Energy Company | 572 | 0.03% |
| 156 | Sibanthracite Group | 541 | 0.03% |
| 157 | Kazakhmys Holding Group | 533 | 0.03% |
| 158 | Whitehaven Coal | 522 | 0.03% |
| 159 | UltraTech Cement | 518 | 0.03% |
| 160 | Stroyservis | 479 | 0.02% |
| 161 | Kuzbasskaya Toplivnaya | 464 | 0.02% |
| 162 | Severoceske doly | 462 | 0.02% |
| 163 | ArcelorMittal (2000-2023) | 458 | 0.02% |
| 164 | LW Bogdanka | 452 | 0.02% |
| 165 | Wolverine Fuels | 413 | 0.02% |
| 166 | SM Energy | 376 | 0.02% |
| 167 | Obsidian Energy | 366 | 0.02% |
| 168 | OKD | 355 | 0.02% |
| 169 | NTPC | 351 | 0.02% |
| 170 | Vale (2007-2022) | 317 | 0.02% |
| 171 | CNX Resources | 307 | 0.01% |
| 172 | Elgaugol | 284 | 0.01% |
| 173 | CRH | 256 | 0.01% |
| 174 | Sev.en Group | 253 | 0.01% |
| 175 | Poludniowy Koncern Weglowy | 250 | 0.01% |
| 176 | Tullow Oil | 229 | 0.01% |
| 177 | TALTEK | 223 | 0.01% |
| 178 | Sokolovska uhelna | 209 | 0.01% |